Energy

Crude Oil
Compares domestic crude oil first purchase price averages for the United States from January 2012 to October 2023 with a derived monthly average of petroleum products supplied in the United States. Product supplied is a metric of petroleum consumption.
Data from U.S. Energy Information Administration.

Natural Gas
Shows average Residential and Citygate prices for natural gas in the United States from January 2014 through February 2022. "Residential Price" is the price of gas used in private dwellings, including apartments, for heating, cooking, water heating, and other household uses. "Citygate Price" is the price measured at a point where the distributing gas utility receives gas from a natural gas pipeline company or transmission system.
Data from U.S. Energy Information Administration.

U.S. Natural Gas and Crude Oil Rotary Rigs
Annual numbers shown are monthly averages. The graph illustrates trends in the numbers of rotary rigs in operation as reported on a weekly basis for the period from 2003 to 2023. It also shows the relative distribution of rotary rigs by drilling objective (crude oil or natural gas). A small number of rigs were used for other miscellaneous purposes. These would include service wells, injection wells, and stratigraphic tests.
Interest / Inflation

Prime Interest Rates
Illustration of monthly average Bank Prime and Federal Funds interest rates for the twelve-year period from 2012 through 2023.
Source: U.S. Federal Reserve Statistical Release H15.

Treasury Notes Interest Yield
Illustration of daily interest yields at constant maturity on one-year, five-year, and ten-year Treasury issues, based on composite quotes provided by government securities dealers to the Federal Reserve Bank of New York on the most actively traded marketable securities from 2012 to 2023.

Consumer Price Index
The Consumer Price Index (CPI) measures changes in prices paid by urban consumers for a specific set ("representative basket") of goods and services. This graph shows index growth for the United States and four broad regions of the country: Northeast, Midwest, South, and West. Source: U.S. Bureau of Labor Statistics

Rate of Inflation, as measured by change in CPI
The graph illustrates change in CPI as a percent of the index value in the same period 12 months ago, not seasonally adjusted.
Source: U.S. Bureau of Labor Statistics
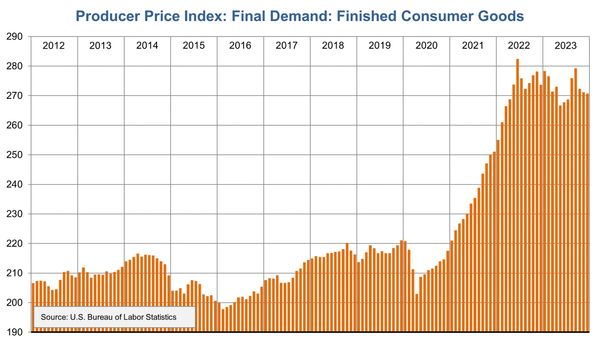
Producer Price Index
While the Consumer Price Index (CPI) seeks to measure prices paid by consumers for products and services, the Producer Price Index (PPI) seeks to measure prices paid to producers for their products and services. The Producer Price Index (PPI) is actually a family of several thousand indexes and sub-indexes generally grouped by Industry, Commodity, or Stage-of-Process. Perhaps the most closely watched PPI is the Finished Goods Price Index, often used as a leading indicator of changes in inflation as measured by CPI. This chart illustrates monthly, seasonally adjusted index growth from January 2012 through December 2023. Source: U.S. Bureau of Labor Statistics

PPI: Finished Consumer Goods 12-month % Change
The graph illustrates change in PPI as a percent of the index value in the same period 12 months previously, seasonally adjusted.
Source: U.S. Bureau of Labor Statistics
PPI Rates of Change by Categories of Goods
The graph illustrates change in PPI for Finished Consumer Goods (see above), Private Capital Equipment, Personal Consumption Goods less Foods, and Finished Consumer Energy Goods as a percent of the index values in the same period 12 months ago, seasonally adjusted.
Source: U.S. Bureau of Labor Statistics
Economic Output

Gross Domestic Product
Gross Domestic Product (GDP) measures the market value of all goods and services produced by labor and property within the United States. This graph illustrates annual GDP in billions of chained 2017 dollars (adjusted for inflation) from 2012 to 2023 (pending release of 2023 data). Source: U.S. Bureau of Economic Analysis

Gross Domestic Product, Quarterly Percent Change
Gross Domestic Product is estimated and released on a quarterly basis. Negative growth (below 0%) for two consecutive quarters is the traditional definition of a recession. This graph illustrates quarterly percent change in GDP as reported in chained 2017 dollars (adjusted for inflation) from 2012 to 2023 (pending release of 4th Quarter 2023 data). Source: U.S. Bureau of Economic Analysis

Housing Starts
Graphic demonstration of non-seasonally adjusted housing unit permits in the United States, Texas and all other states for the twelve-year period from 2012 through 2023.